
3 Signs Your Team Is Ready for a Metrics Layer
Most teams don't realize they need a metrics layer until they aren’t sure which report to trust (if any).
What is a metrics layer?
A metrics layer acts as a central translation layer between your technical data models and anyone who wants to interact with your data. It allows your team to provide consistent definitions for key business metrics across all your reporting and analytics so that shared KPIs are always calculated in a consistent way no matter who’s doing it.
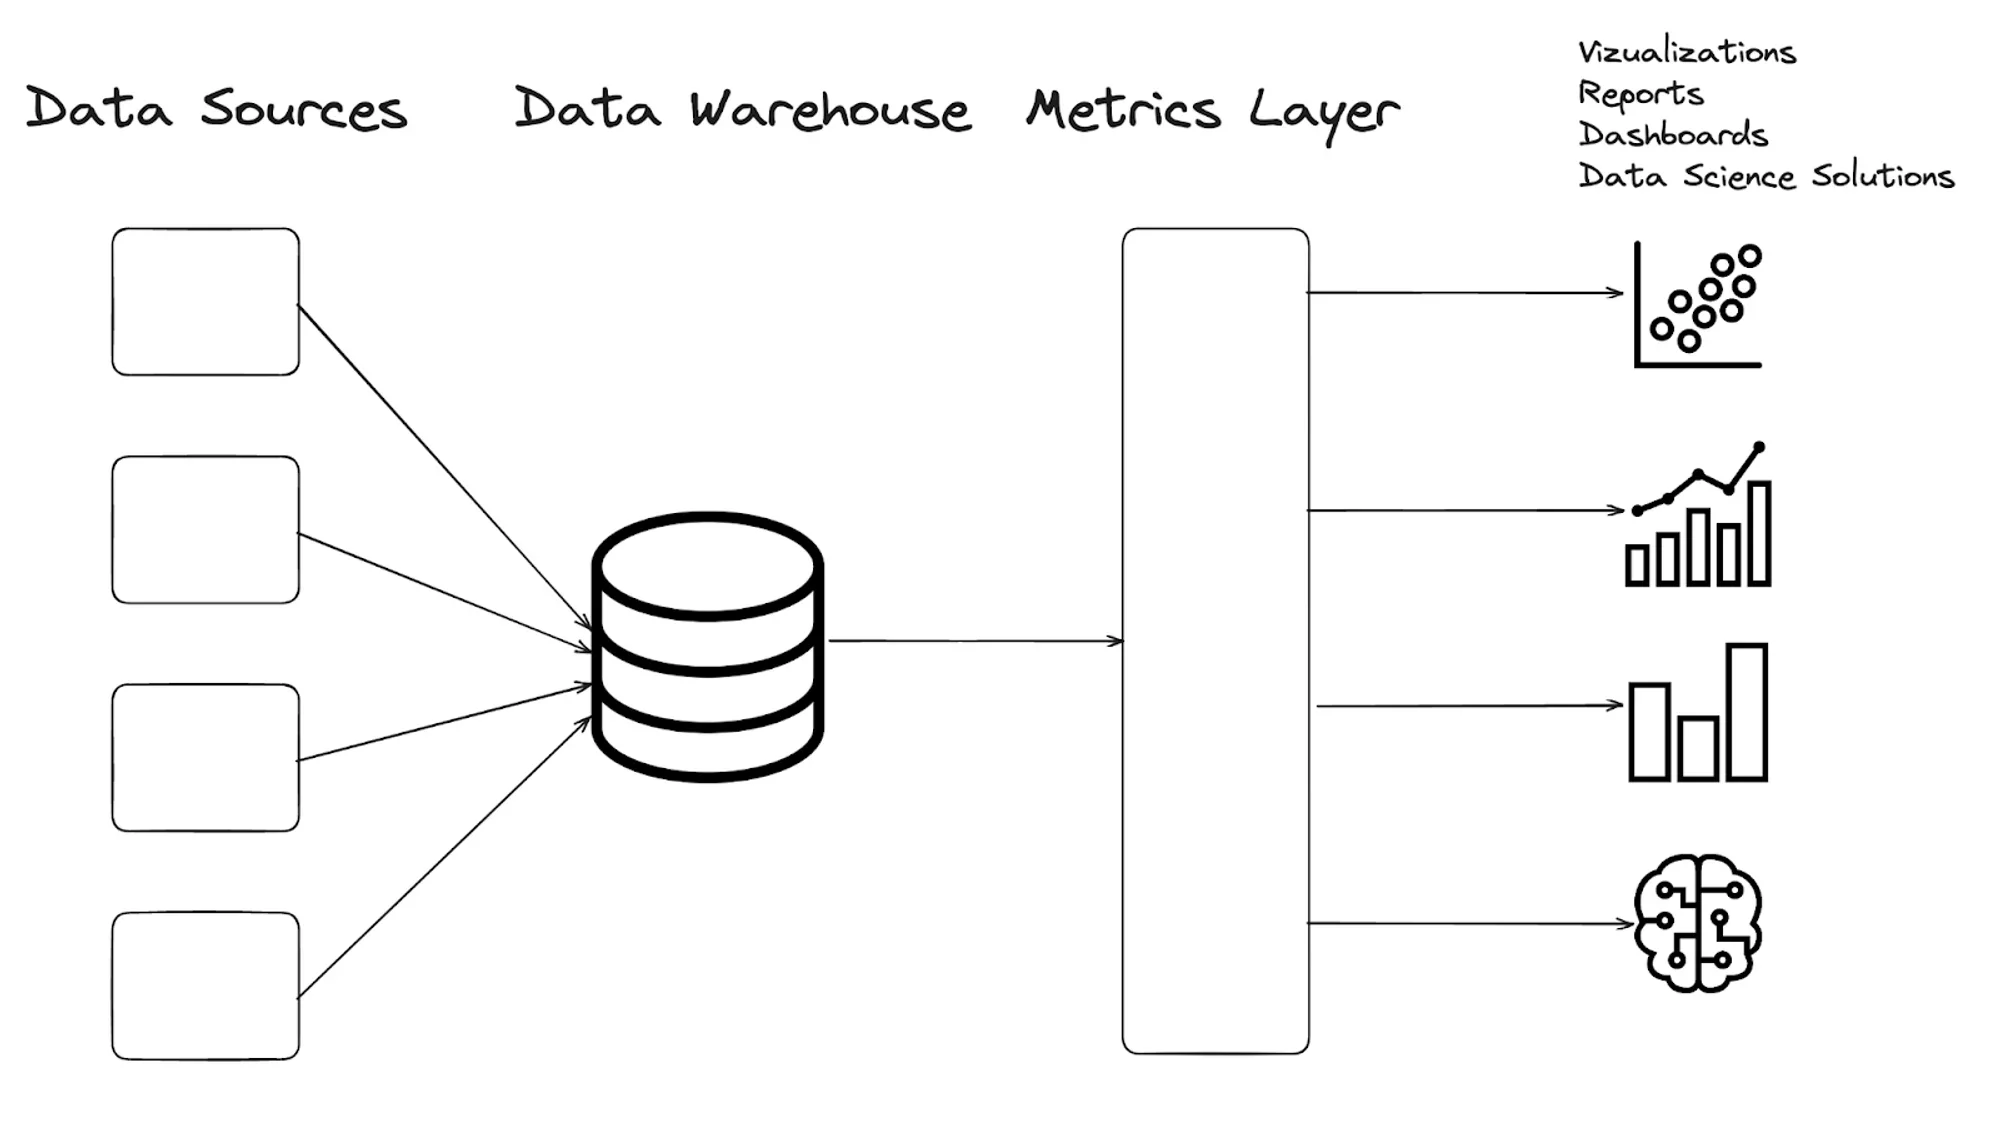
The concept of a metrics layer - Image by Atlan.
Analytics environments get more complex as companies grow. If we were sitting across from you we might ask: Are your dashboards governed and maintained by a data team? Does your data live in a mix of legacy and ad-hoc reports that stakeholders built themselves? Are you afraid to make changes because your team is relying so much on the systems as they stand?
We see similar patterns show up across teams, and those patterns usually point us in a direction where a metrics layer becomes necessary. Here’s some of those signs:
Sign 1: Analytics Sprawl
Your analytics are living in nooks and crannies, and there’s no way to update definitions in a unified way. Now no one trusts each other’s reports.
How does this happen?
Maybe there was a time when the dashboards were unified but at some point someone needed information that wasn’t available there. This can happen when a new data source enters the picture that produces its own reports. Rather than connecting the sources to a shared data warehouse, the information lives completely separated. When teams begin to focus on shared quarterly goals, every department needs to understand their slice. Without a centralized foundation flexible enough to support that, the requests either pile up in the analyst backlog or people start building their own ad-hoc calculations outside the governed stack.
Either way, the cycle of sprawl begins. Without process, team members maintain and run their own reports, which wind up siloed from other cross-functional teams. Now these teams are missing pieces of the story, and confidence in the numbers begins eroding.
Sign 2: Investigation Backlog
Conflicting metrics pull analysts into reconciliation work. Instead of finding and using the insights, they’re spending time tracing and validating legacy logic to understand why metrics look different, and determine which numbers are correct. Every hour spent validating data is an hour not spent on deeper analysis.
As your team spends more time digging into these issues, the stakeholders begin questioning the data, creating a vicious cycle where analysts spend more time maintaining reports than creating them, and stakeholders lose faith in the analytics function's ability to deliver value.
Sign 3: Lack of Documentation
Even if you modeled all your data perfectly and had a top notch dbt project, you don’t have the necessary buy-in, training, adoption, or documentation you’d need for the team to be on the same page. As organizations grow and new team members join, they either need to be able to seamlessly interpret what you've set up or they'll go it alone. In time, they figure out their own ways to get the information they need. This can kick off another cycle of creating new dashboards or answering the same questions over and over again instead of empowering people with knowledge to self-serve.
In today's world of agentic coding, this problem becomes even more critical. Without proper documentation, AI agents will make their own assumptions about how metrics should be calculated, potentially creating yet another layer of inconsistent definitions and calculations. And they can do it way faster than humans. When new hires or AI assistants can't find clear guidance on how metrics work, they inevitably create their own variations, restarting the entire cycle of confusion.

How a Metrics Layer Can Help
A metrics layer solves a pretty simple problem that shows up in complex ways: everyone is calculating the same metrics differently. Instead of definitions living across dashboards, queries, and spreadsheets, a metrics layer creates one place where those definitions live and makes sure they’re used consistently everywhere.
That shift has a huge impact! Stakeholders get dashboards they can trust and teams can build on top of each other’s work instead of constantly redoing it. It also makes self-serve possible in a real way. Most teams know they need this. It’s just hard to prioritize because it feels like a big, cross-functional lift.
And to be fair, it used to be.
Where Tools Like Lightdash Come In
Implementing a metrics layer no longer requires introducing an entirely separate system. Tools like Lightdash sit directly on top of your dbt project, so your metric definitions live in the same YAML files your team is already using.
There’s no new language to learn, no heavy configuration layer to manage, and no extra infrastructure to stand up. That matters a lot, especially for smaller teams. Lightdash covers what you’d expect from a modern BI tool – intuitive exploration, crispy clean visualizations, filtering, and segmentation – and it feels familiar if you’ve used something like Looker before. It’s quick to implement, easy to maintain, and structured enough to grow with your team.
It’s also one of the more cost-effective options in the space, especially if you choose to self-host. Tools like Metabase can be similarly affordable, but don’t offer the same level of built-in semantic layer integration with dbt, which is where a lot of the long-term value comes from.
Ready to implement a metrics layer?
A metrics layer doesn’t need to be a massive lift. It’s often just the next step for teams that already have dbt in place but are feeling the strain of scale.
We work with teams to get this right (often partnering with Lightdash), from dbt model to governed, self-serve analytics. Maybe you don’t have a centralized data warehouse with your sources connected. Maybe you have a centralized data warehouse but you don’t have a dbt project to organize that information. Maybe you have a dbt project but you don’t have that flowing into a BI tool. Maybe you’re using BI tools but there’s no shared metrics definitions. If you're tired of the reconciliation cycle and want a strong foundation, we'd love to talk!