
Uncovering Hidden Insights in your Monthly Recurring Revenue (MRR)
Author: Chisom Mbama
Finance is the backbone of most companies. Every hire, every product bet, every push into a new market eventually comes back to one question: what do the numbers say? The numbers always tell the story, and they determine a lot of what happens next.
For subscription and SaaS businesses, one number sits at the center of that story: MRR.
What is MRR?
MRR, monthly recurring revenue, is the predictable revenue a business expects to earn every month from its active subscriptions. It leaves out one-off payments like setup or implementation fees, and it spreads longer contracts across the months they cover, so an annual plan counts as one-twelfth of its value each month.
MRR = Sum of monthly subscription revenue from all active customers
Or, put simply:
MRR = Number of active customers × Average revenue per customer per month
So if you have 100 customers paying an average of $50 a month, your MRR is $5,000.
More than one number
For most teams, MRR is a status check. Someone pulls the number at month-end, compares it to last month, and moves on if it went up.
The problem is that the total is a sum of very different things happening at once. Customers are signing up, upgrading, downgrading and cancelling in the same month, and a single figure blends all of that into one result. Two months with the same MRR can come from completely different activity.
So the useful view is the breakdown. Each month, MRR moves for one of five reasons:
New MRR: revenue from customers who just signed up
Expansion MRR: existing customers paying more, through upgrades, extra seats or add-ons
Contraction MRR: existing customers paying less, through downgrades or dropped seats
Churned MRR: revenue lost from customers who cancelled
Reactivation MRR: former customers who came back
Your total MRR is what's left after all of these net out. The three insights below come from looking at these pieces, not just the total.
Insight 1: Losing customers while MRR grows
A rising MRR doesn't always mean a growing customer base. The two can move in opposite directions in the same month.
Most teams look at the dollar amount in each MRR movement: how much came from expansion, how much was lost to churn. Far fewer look at how many customers sit behind each of those amounts, and that's where this pattern hides.
Say ten small customers cancel in a month, while two or three of your largest accounts upgrade. The upgrades can be worth more than everything the ten customers were paying, so total MRR stays flat or even rises. Your revenue report shows a good month, but your customer list is ten names shorter.
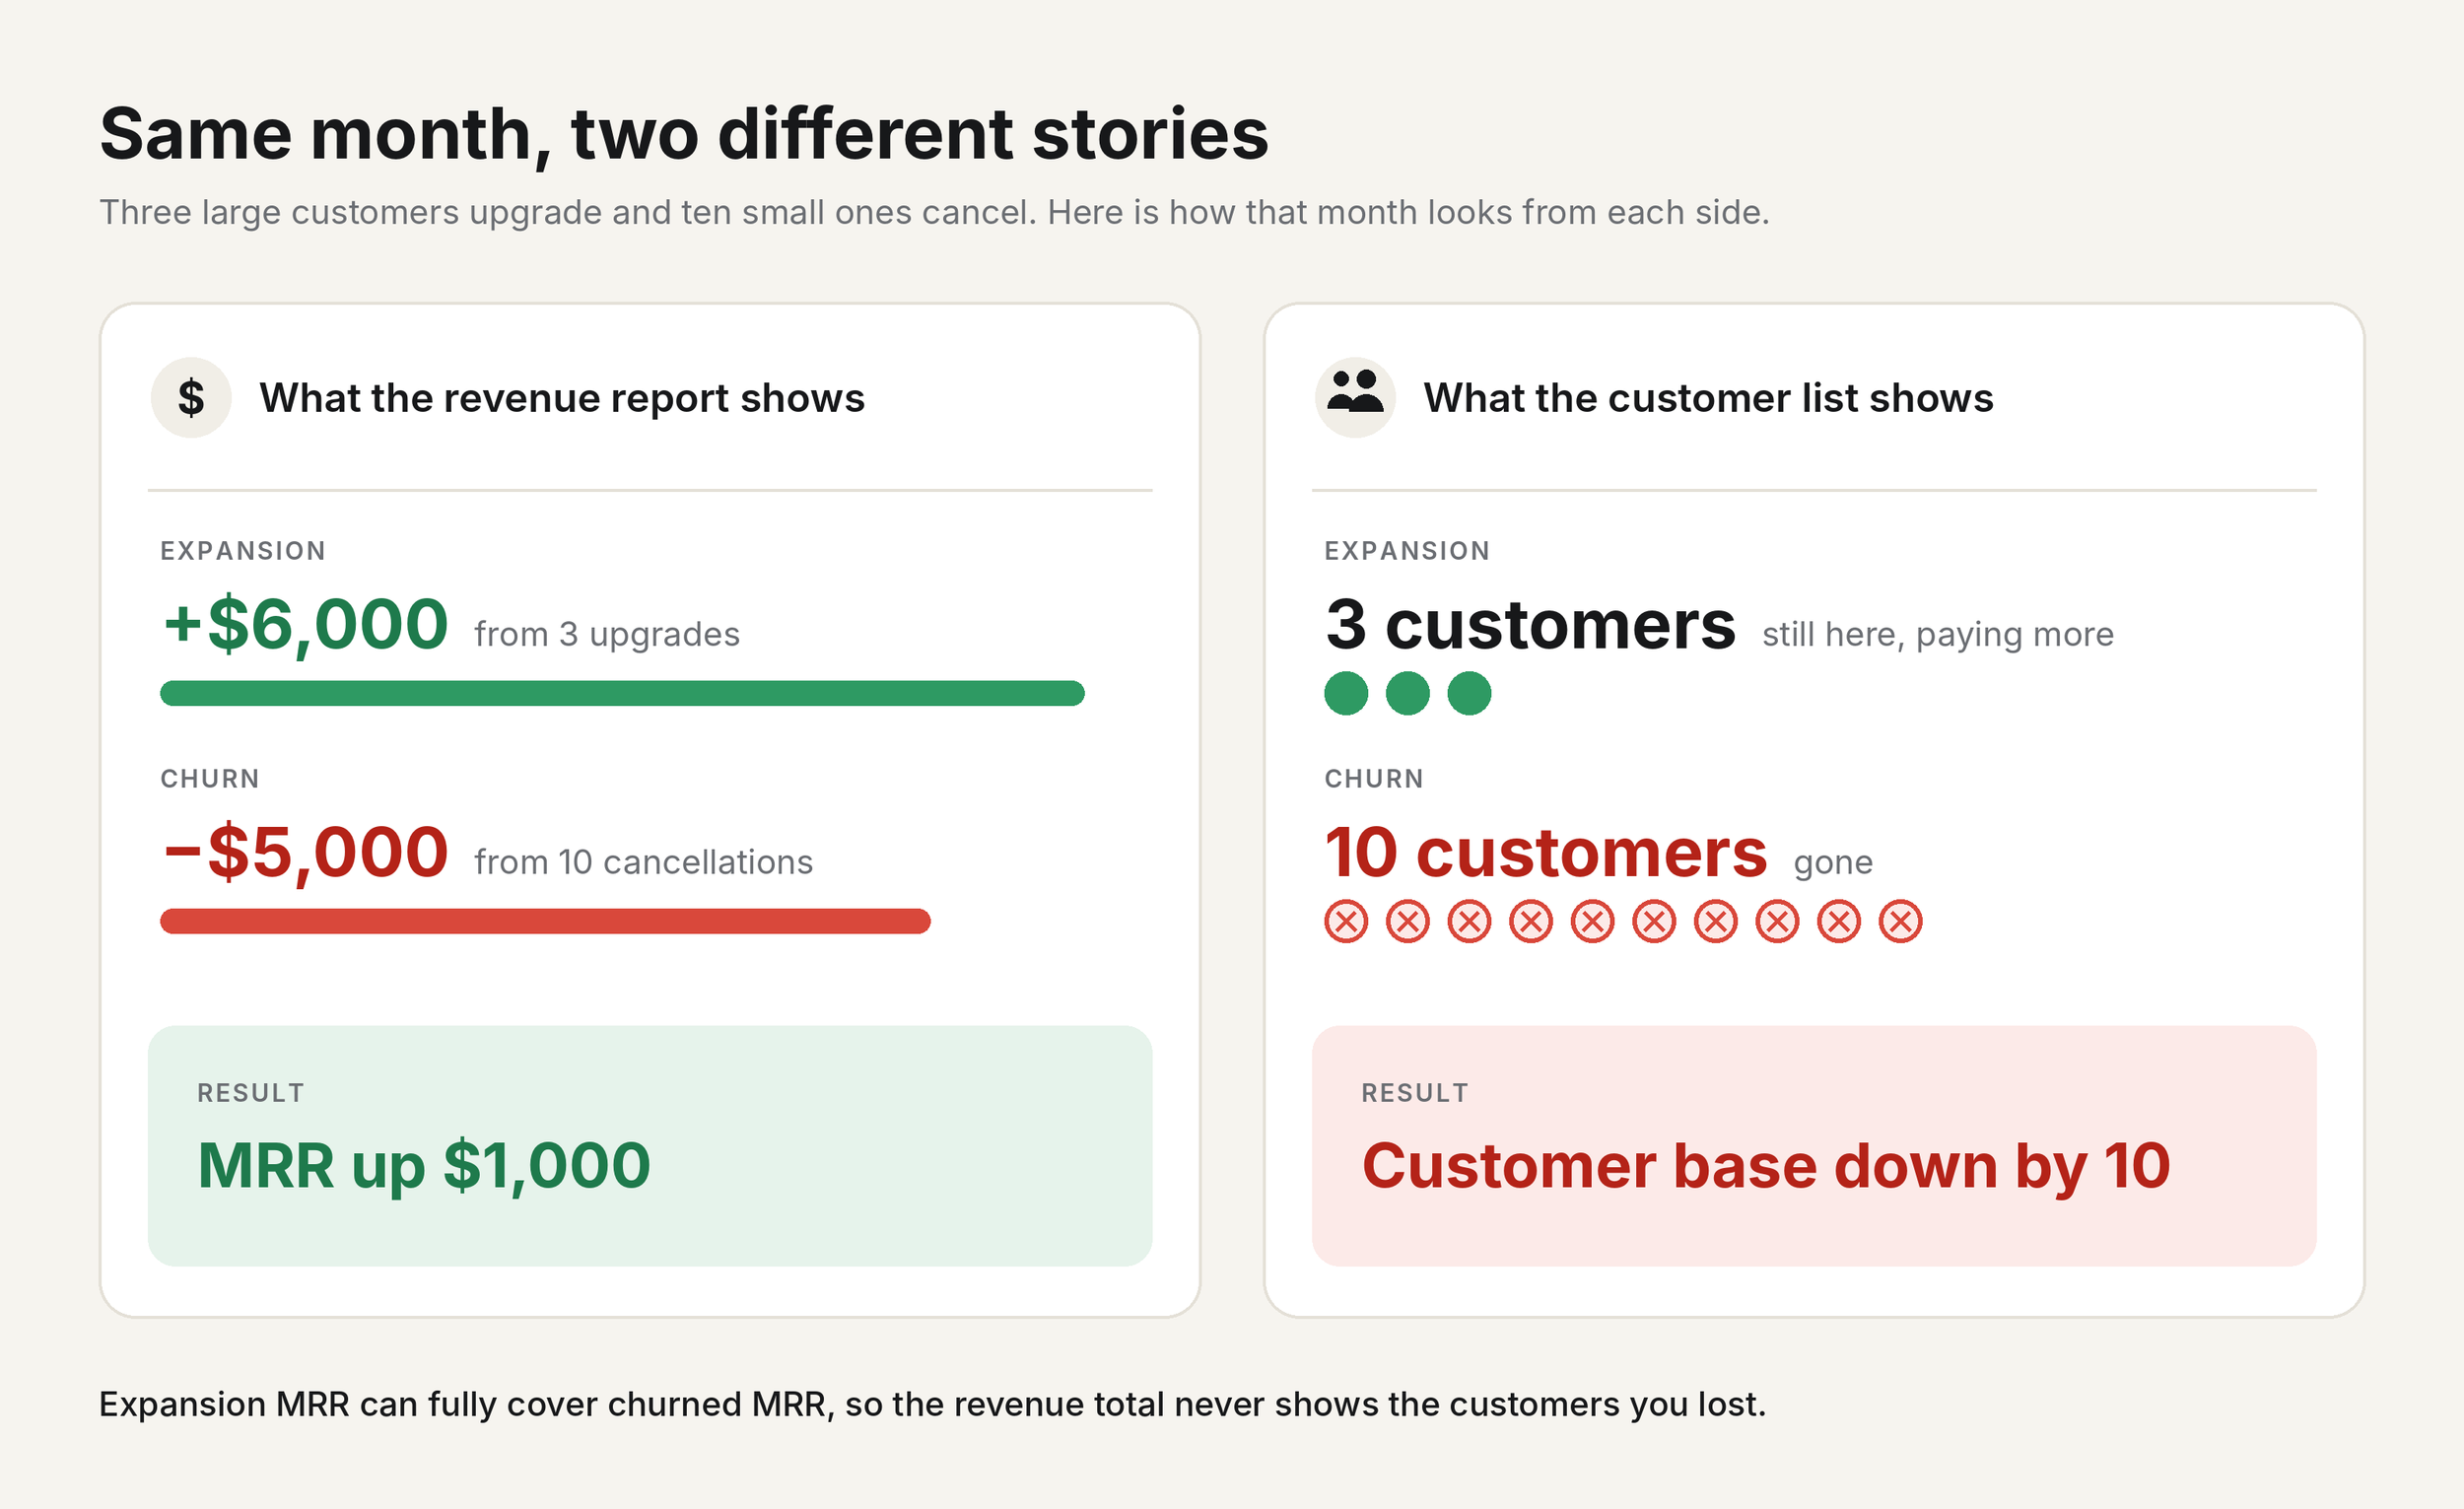
Expansion from a few large accounts can mask churn across many small ones (Image generated using Claude)
The dashboard says the business is fine. The customer count says customers are leaving. Tracking both, side by side, is how you spot the problem while there's still time to respond.
Insight 2: Losing revenue as fast as you gain it
Two companies can report the same small increase in MRR for the month and still be in very different positions. At the first company, very little changed during the month: a few new customers signed up, almost no existing customers left, and the business grew slowly but steadily. At the second company, the sales team closed a large amount of new business, but cancellations and downgrades from existing customers took away nearly all of that new revenue, which means the team worked hard all month only to end up roughly where it started.
Net MRR growth cannot show the difference between these two companies, because it only reports the result after gains and losses have been combined. It tells you how much MRR went up, but it does not tell you how much new revenue actually came in or how much existing revenue was lost along the way, and that missing detail is often where the real story sits.
To see what is happening, you need to look at both sides of the movement at the same time, comparing the revenue gained from new and expanding customers with the revenue lost through churn and contraction. When both of those figures are large and close to each other, the business is spending most of its effort replacing revenue it has lost rather than adding new revenue on top of what it already has, and any growth forecast built on the net figure alone will look healthier than the business really is.
Insight 3: How long a customer takes to pay you back
Every new customer costs money to win, whether that money goes into advertising, sales salaries, software tools, product demos or the discounts offered to close the deal. When you add those costs together and divide them across the customers they brought in, you get your customer acquisition cost, or CAC. CAC payback measures how many months it takes for a customer to bring in enough revenue to cover what you spent to acquire them, and MRR is the figure that makes this calculation possible.
CAC payback (months) = Customer acquisition cost ÷ MRR per customer
For example, if it costs $600 to acquire a customer who pays you $100 every month, that customer will have paid back their acquisition cost after six months. From that point on, the revenue they bring in is a return on that investment rather than a repayment of it.
This number has a direct influence on some of the biggest decisions a company makes about where to spend its money. A short payback period suggests that the business can afford to invest more heavily in sales and marketing, because new customers recover their cost quickly. A long payback period suggests the opposite, and it is usually a sign to slow down and look more closely at pricing or retention first, since customers may be cancelling before they have ever paid back what it cost to bring them in.
If your systems are giving you different answers, that needs to be settled before any of these insights can be trusted.
These three insights can change how a company spends, hires and plans. But each one rests on MRR being calculated correctly, and that's often not the case.
When ProfitWell polled 50 SaaS companies on how they calculate MRR, 2 in 5 were counting trial or free users in some way, 1 in 5 were removing expenses from the figure, and most were breaking down their annual or quarterly payments incorrectly.
Part of the problem is that MRR often lives in more than one place. The CRM, the billing system and the accounting system can each produce their own version, and no one has agreed which one is the source of truth. If yours are giving you different answers, that needs to be settled before any of these insights can be trusted.
How Database Tycoon can help
Database Tycoon is an NYC-based data consultancy. We help teams define their metrics once and use them everywhere, through metric governance and semantic layers, so your CRM, billing system, dashboards and finance reports all calculate the same numbers the same way. When every team works from one trusted definition, the numbers stop being debated and start being used to make decisions.
If your teams are getting different answers to the same question, let's talk. Reach us at info@databasetycoon.com.
Watch the video version: Hidden insights in your MRR
Chisom Mbama is a Senior Analytics Engineer and consulting partner at Database Tycoon, specializing in Snowflake, dbt, and a range of BI tools. She helps growing teams turn messy data into reporting they can build on, and get their data foundations ready for AI.
