
I Learned Omni by Building an Astrology Dashboard: An Unconventional Use Case for BI Tools
Author: Chloe Anderson
I knew Omni. Familiarity is not fluency.
I've been leading partnerships at Database Tycoon since the start of the year. We partner with Omni to deliver BI solutions to our clients, and I had even started their certification course alongside our engineering team. But I was living in the gap between knowing how to use a tool and actually understanding what I was selling.
I hit the workbook layer fine: connecting a data source, building analyses, dragging fields. Am I a data engineer now? Then the modeling section arrived. Topics, shared models, branching, the model IDE. I threw in the towel. And that's exactly when I understood why the architecture matters: how fields relate to views, how views compose into topics, how the workbook model sits on top of the shared model. I just couldn't see it yet.
Months later, deep into my vibe-coding era via Python, SQL, and Claude Code, I decided to go back. This time on a topic I know way too much about: ✨ astrology ✨
The Setup
I already had my own birth chart saved as .md files, (because I am in fact a Capricorn moon) in my personal Claude project: natal placements, my transits for the year, macro transits across 2024, 2025, and 2026, and my astrocartography. That was person one.
For the other four, I picked random birth dates and times, pulled the data from astro-seek.com, and built out the same .md structure for each. Then I asked Claude to compile everything into one master CSV. Flat, clean, one row per placement.
I created a new project in MotherDuck and loaded it straight in. MotherDuck runs on DuckDB, which reads flat files natively, so there's no pipeline to set up, no staging step. Just load the file, the table exists, the data is queryable. I connected the MotherDuck database to Omni using their native connector, entered my credentials, and the schema was sitting there on the Omni side in just over two minutes.
The moment the connection was live, Omni offered to take me straight into the Workbook agent. I let it take the wheel, not to test whether I could configure a BI tool, but to see what Omni's agent could do with storytelling.
So, what did the agent build?
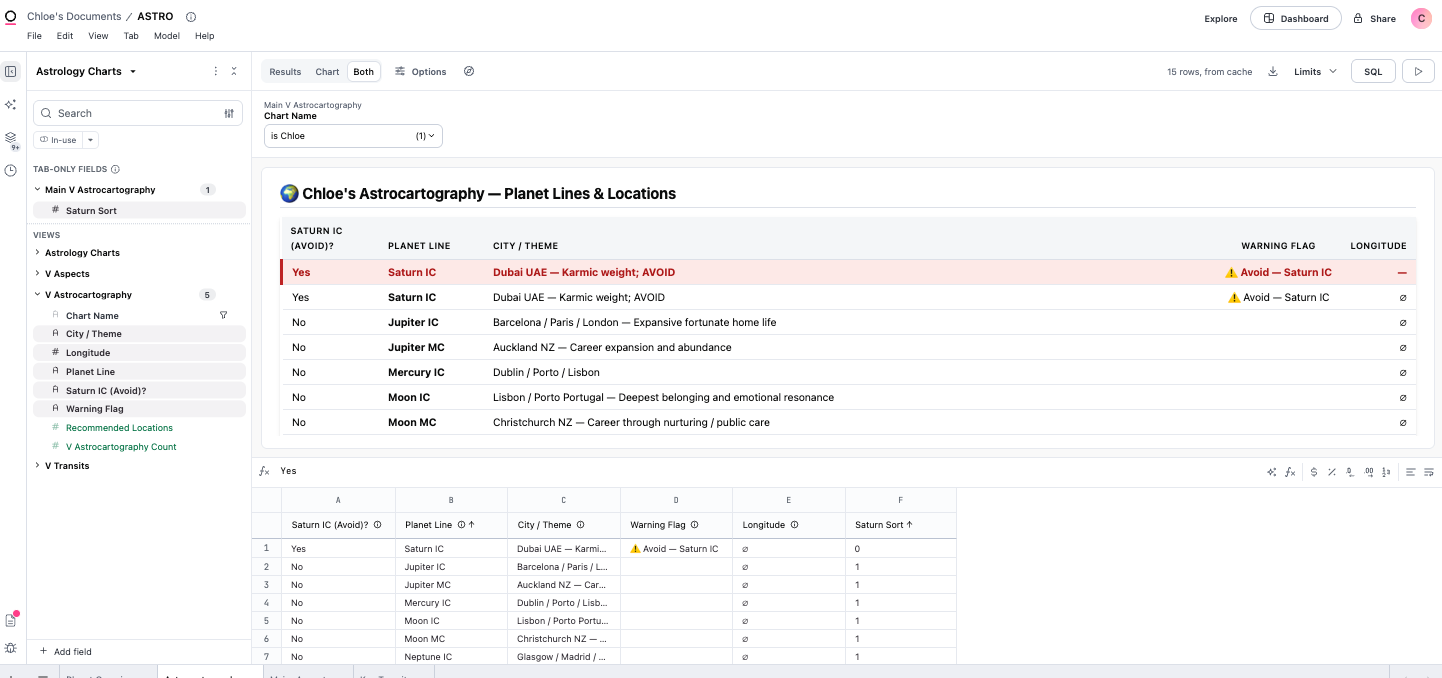
I asked the agent in plain english to build me a dashboard with a planet overview, a per-person filter, a deep dive, and an astrocartography tab with Saturn IC flagged as a location to avoid. I asked the Agent in plain English to build me a dashboard with a planet overview, a per-person filter, a deep dive, and an astrocartography tab. For each chart, I wanted the Saturn IC line flagged as a location to avoid. Saturn IC is where Saturn sits at the base of your chart, the part that rules home and private life. You can build something lasting there, but restriction, weight, and karmic obligation will come for you first, and most people don't want to find out what that actually takes.
Here's what that actually looked like. The agent started by exploring the schema, pulling up each of the four views and reading what was in them. Then it built a topic, which in Omni is the structure that connects your views into something queryable, with v_planets as the base and the other three joined to it. It created the relationships between them, defined measures like element counts, modality breakdowns, and a 7th house placement count, and generated a query for each dashboard tab. Then it validated the entire model before writing anything to the workbook.
Each step appeared in a task list as it completed. I could see exactly where it was, what it had just done, and what it was about to do next. Nothing was happening behind a loading screen.
That sequencing matters more than it sounds. In the certification course I had gotten stuck because I couldn't see how the pieces connected. Fields, views, topics, the shared model, it was all described to me but I couldn't picture it. Watching the agent assemble the same architecture against data I recognized made it real in a way that reading about it never did.
Worth noting: the agent has gotten noticeably sharper since I last used it in January. The task sequencing and model construction felt more deliberate this time.
In the first build, I learned what was possible, and in the second, I made it possible.
The initial dashboard was solid: five people, four tabs, clean queries, Saturn IC flagged in crimson in the astrocartography view.
Then, I realized that truthfully, this was just… data, packaged neatly of course. But in my year and six months immersed in the world of vendor tools and data services, clients don’t really care about the data itself. They care about the story. What does this data show them about their business? A dashboard, nonetheless, is just a dashboard if it doesn’t tell you anything.
Who would actually be using Omni to present an astrology dashboard? Professional astrologers, obviously. So, I told the agent: imagine you are building this for a client. Her data should be central. Everything else is context.
That single reframe produced a completely different output.
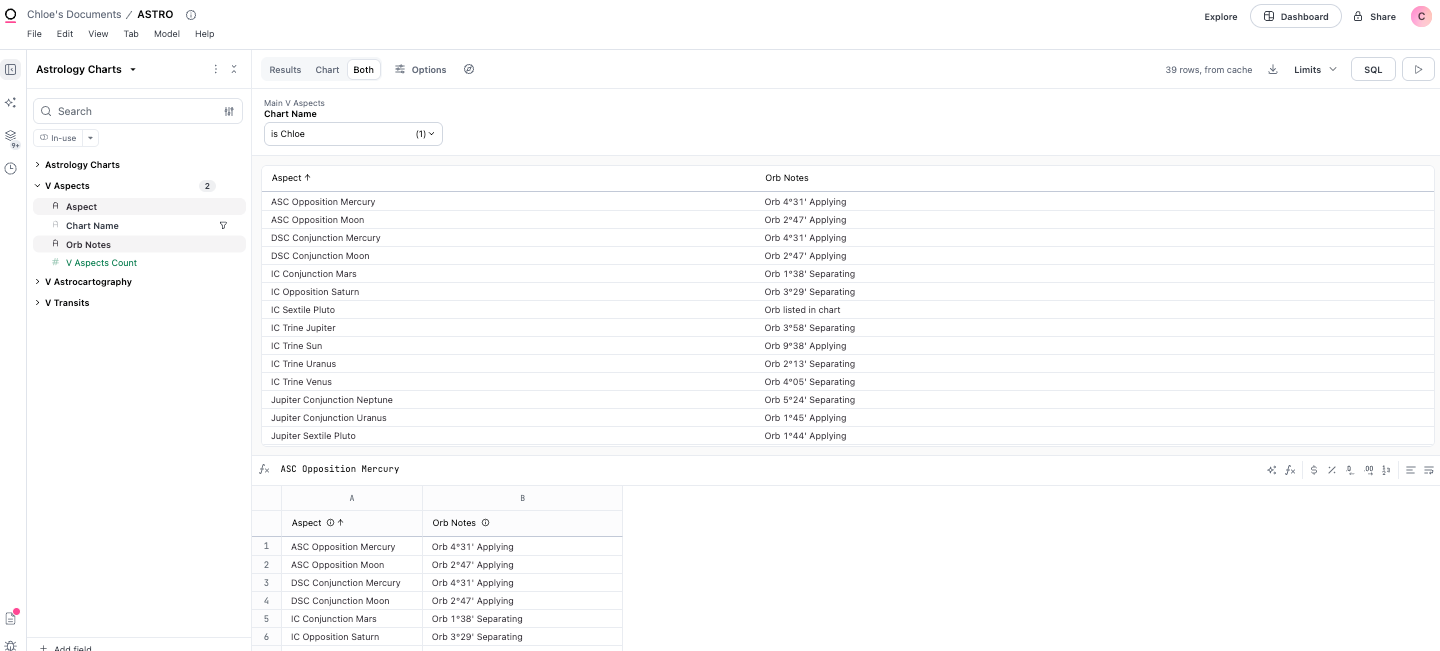
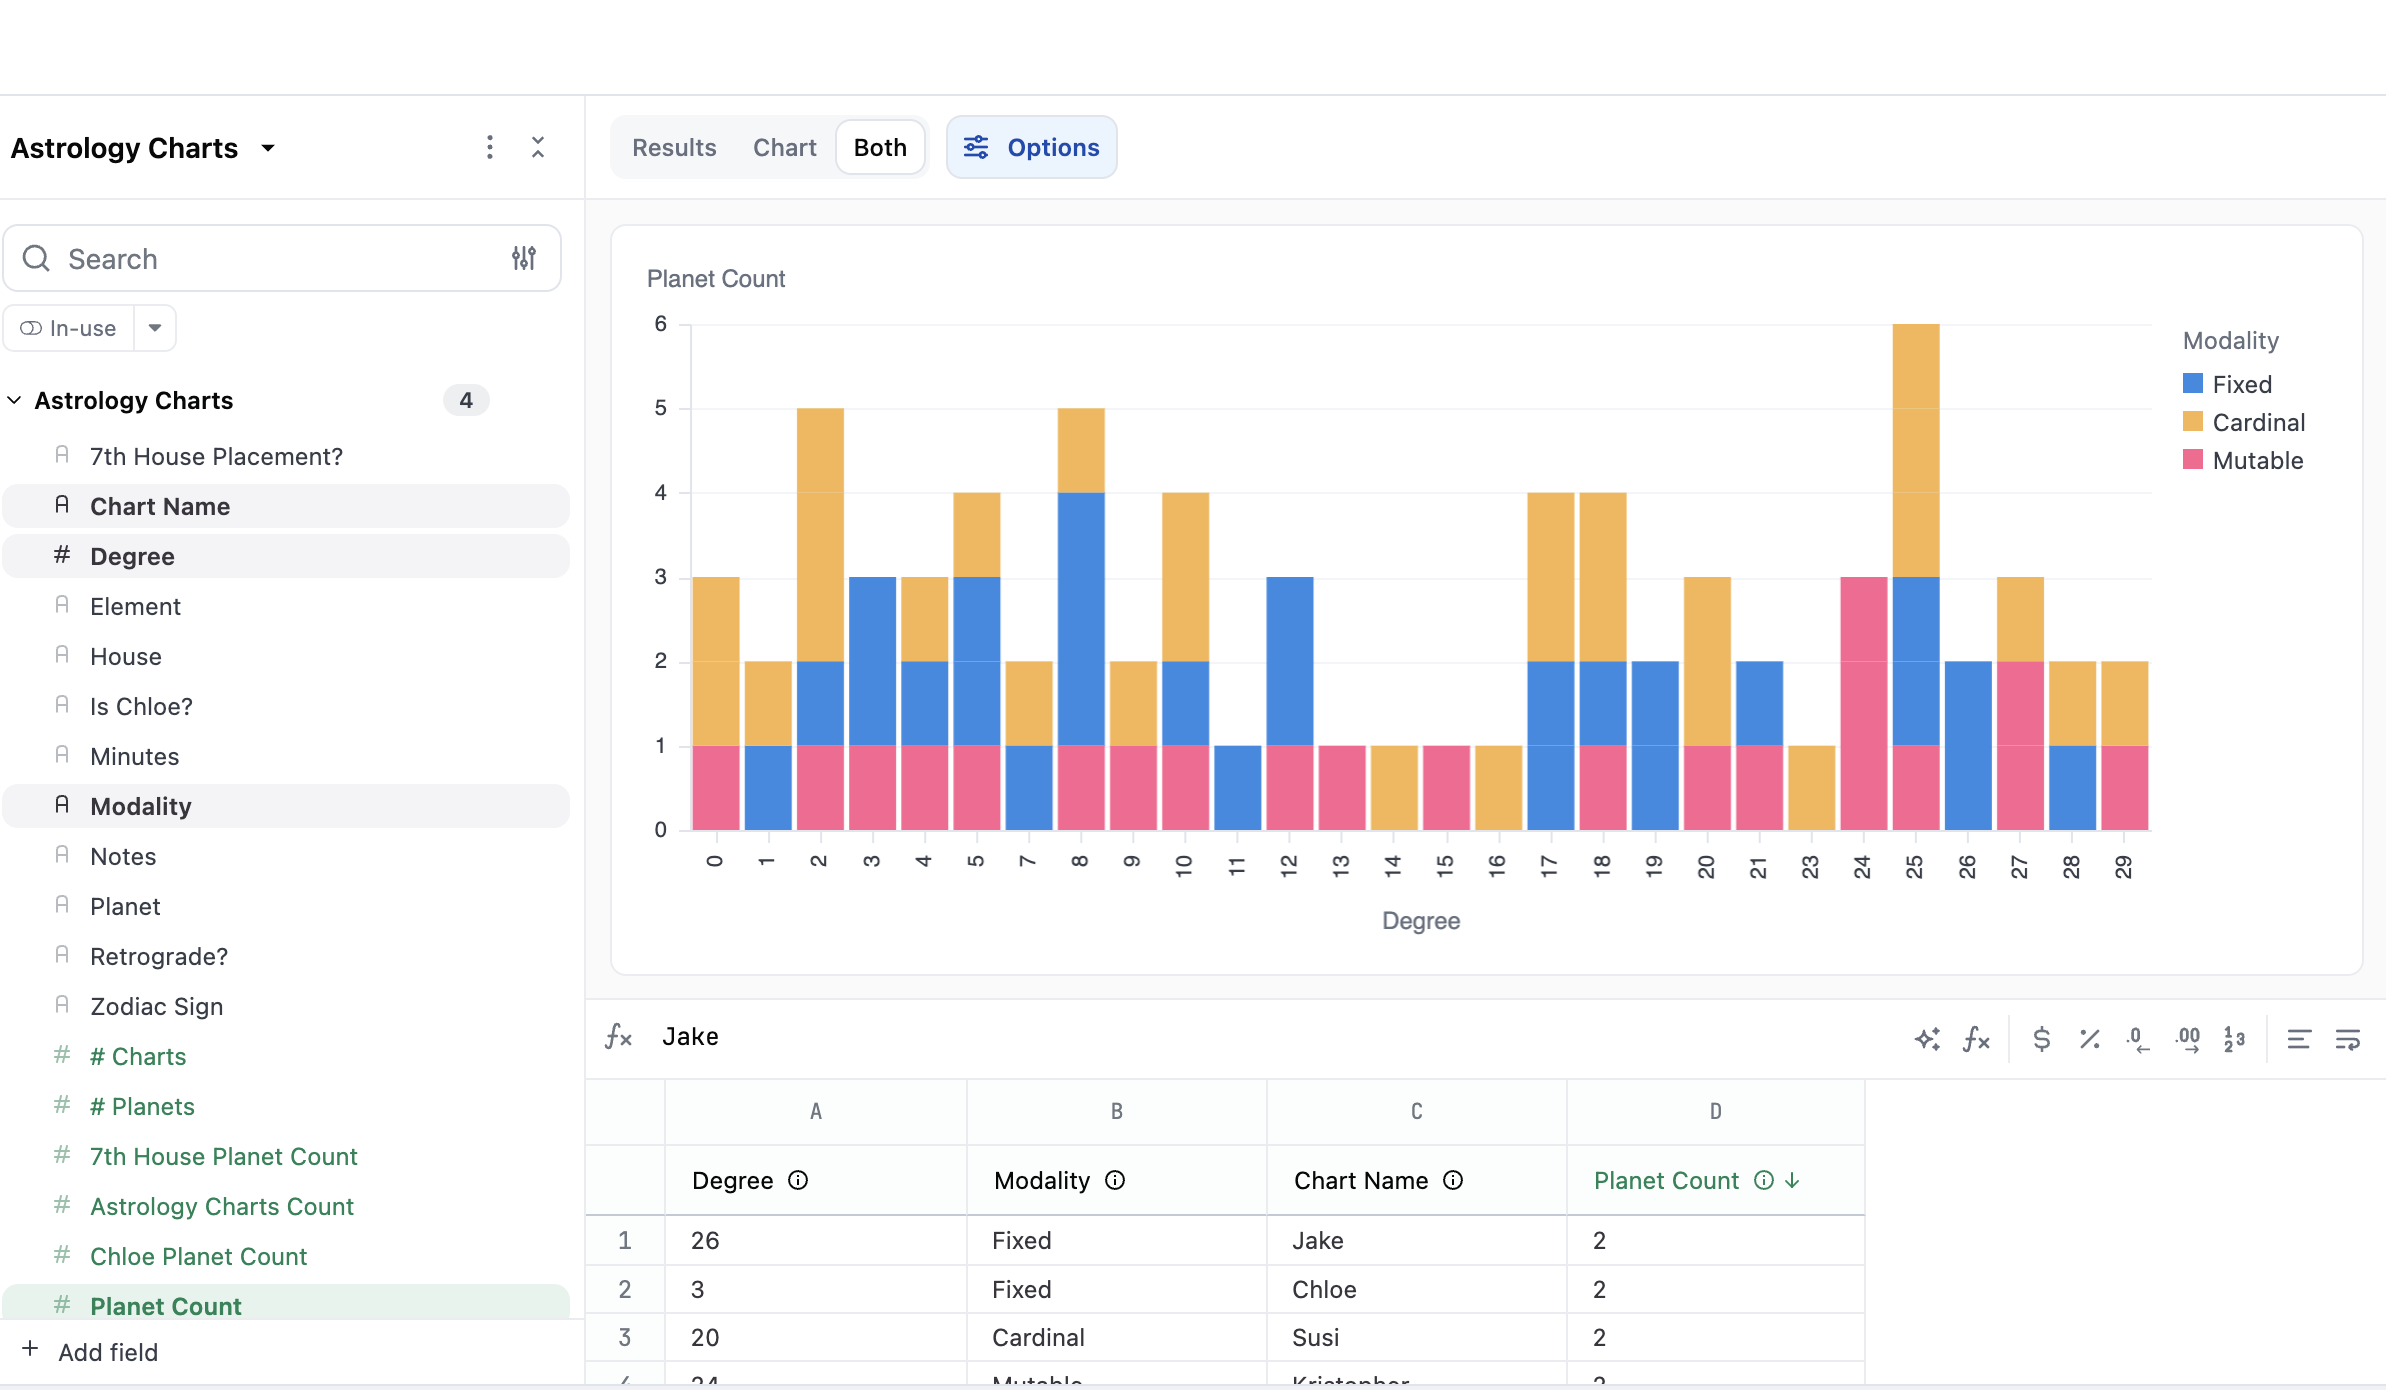
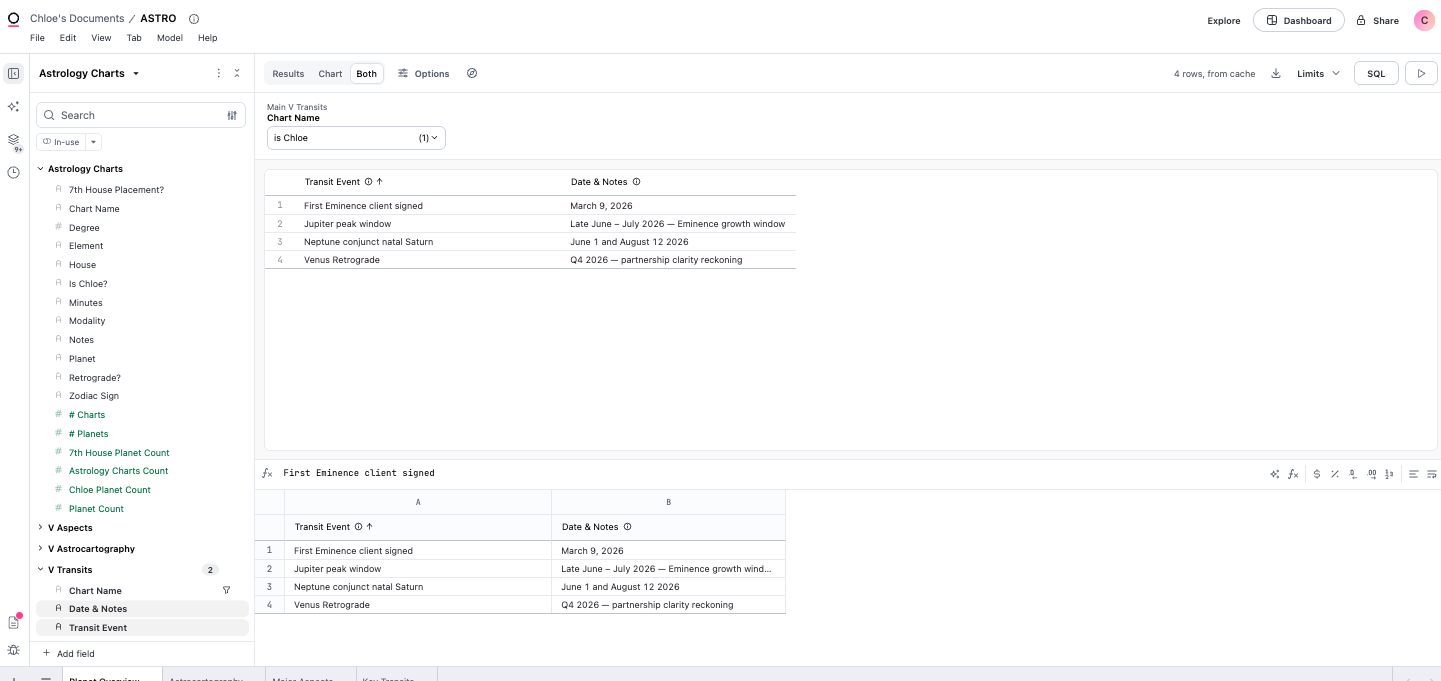
All four tabs were rebuilt around one person. Her sign distribution became the primary bar chart, with the other four people in muted grey as reference. Her natal placements were sorted by house, with 7th house rows highlighted and her Saturn Return row called out in amber. Her 2026 transits became the hero section, rendered as styled cards with color, context notes, and timeline structure. Her astrocartography view floated Saturn IC to the top, impossible to miss.
The group data was still in the model, but I structured them to be other people in the client’s orbit, not just standalone. Because an astrologer would use Omni to visualize astrological data client-by-client, not just create some fun cluster chart of every client’s signs (How many Virgo risings do I see? That is great data. But just fun for the astrologer, not useful to a client.)
That is the difference between a dashboard that shows, and one that speaks.
So is Omni the right choice?
Truthfully, we are in a BI renaissance, but that also means the market is heavily saturated with dozens of tools with drag-and-drop interfaces, AI agents, and promises of self-service. The feature lists begin to blur together, and a lot of decision makers give up at the decision fatigue. Like differentiating one shade of pink from another.
So, how does Omni actually differentiate itself in the big sea of BI?
To be transparent, Omni may not be the easiest entry point. The modeling layer has a real learning curve and does require an implementation partner or an in-house data team to engineer, maintain and build.
But what truly makes Omni stand out, is that the technical rigor on the backend, allows those who rely on the data, those who need to present a story with the data, to tell that story with authority and reliability. The trust is in the semantic layer, the trust is actually what is being engineered. .
And as for me, I did not fully see that until I watched an agent build a topic from my own data in real time. All in all, building a passion project in any tool you’re learning is a dynamic way to really familiarize yourself in an ecosystem. Whether you write python scripts on the daily, or you have to ask Claude “what is SQL.”
All roads lead to the return.
Database Tycoon partners with Omni to deliver modern BI solutions. If you're thinking through what the right visualization layer looks like for your stack, we're happy to think it through with you.